
How to Read the World Class Benchmarking Triangle
The World Class Benchmarking triangle is Uncovered Thai Stocks' scorecard ranking a company from 1 to 10 against global sector peers.

คลิกเพื่ออ่านบทความฉบับภาษาไทย
The World Class Benchmarking triangle is a scorecard that compares the subject company to global sector peers of similar size. Research we have conducted shows that companies that improve their rank on the World Class Benchmarking scorecard also see share price gains.
The top of the triangle is what matters: Profitable Growth. Our research shows that high Profitable Growth companies gained almost 10x the market over 20 years.
The results at the top of the triangle are explained by the results below. Levels two and three of the triangle explain what is driving the Profitable Growth. Our research shows that the market values growth more than profitability, but the best is, of course, when companies have both.
Each number in the triangle is a decile rank relative to global peers
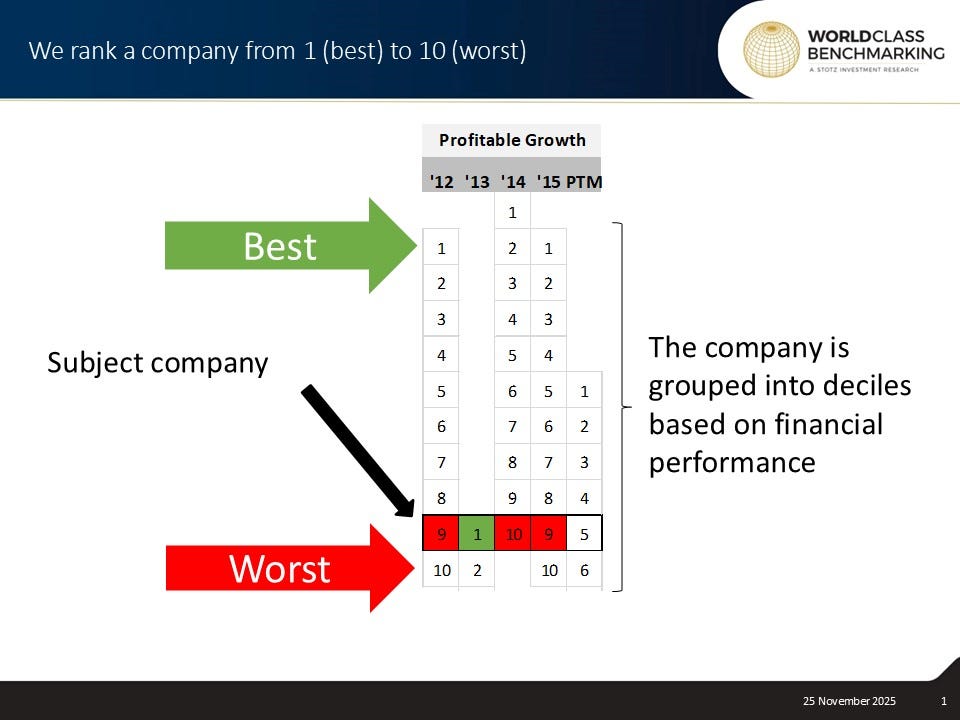
In World Class Benchmarking, we rank all companies from 1 (best) to 10 (worst) against all sector peers of similar size.
We use a global universe of 27,000 non-financial companies. No two companies are alike, but some are more alike than others, so we compare the subject company to companies in its sector. A large company should not be compared against a small company and vice versa. So, we classify the business based on its size: small, medium, or large.
We rank the subject company from 1 (best) to 10 (worst). If you see that the rank is colored in green, it means the company is World Class. If the rank is colored in red, the company is very bad relative to peers on that measure.
Let’s look at an example.
In the case shown below, in the year 2012, we ranked companies from best to worst. The subject company ranked in the 9th decile relative to global sector peers of similar size.
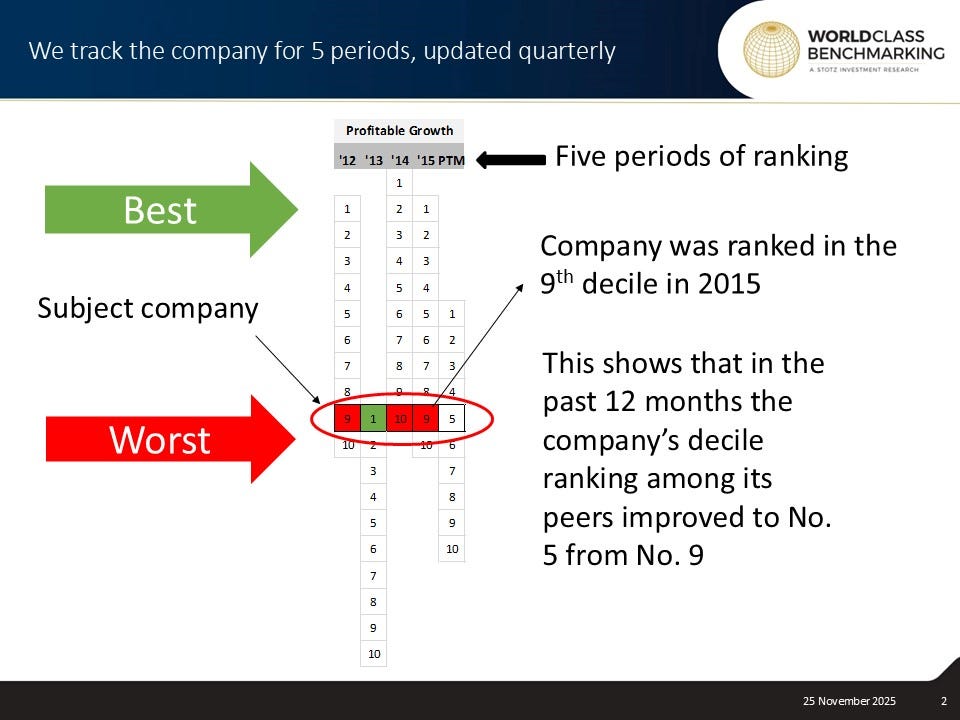
We are looking at five periods in the scorecard: four full fiscal years and the past 12 months (PTM). In the case below, the company was ranked in the 9th decile in 2015, and over the past 12 months, it improved to the 5th decile.
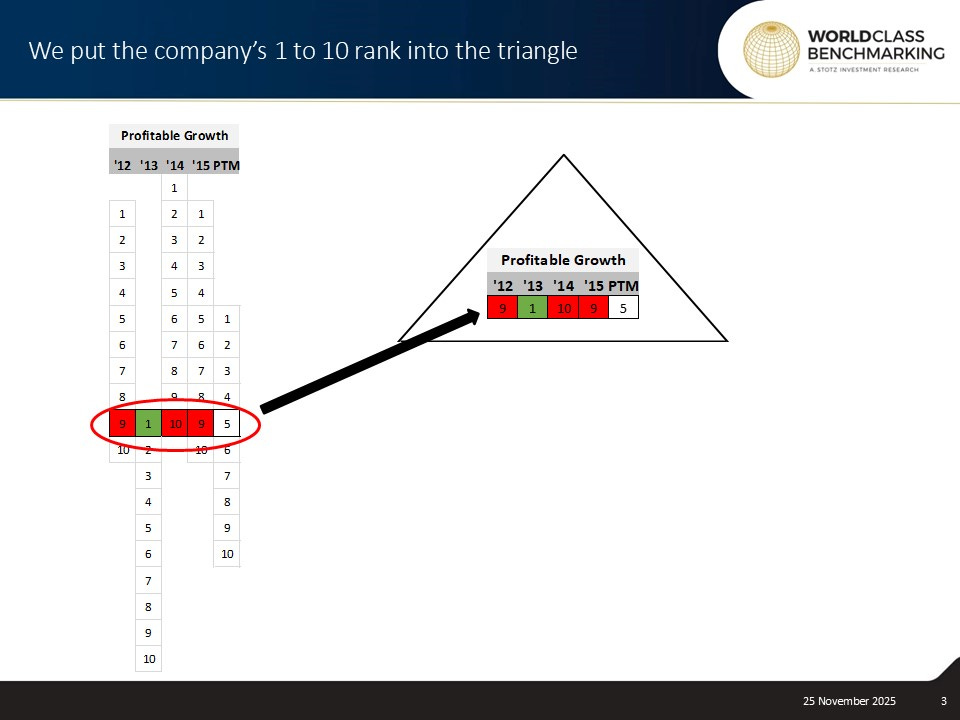
We then put that company’s rank from 1 to 10 into the triangle.
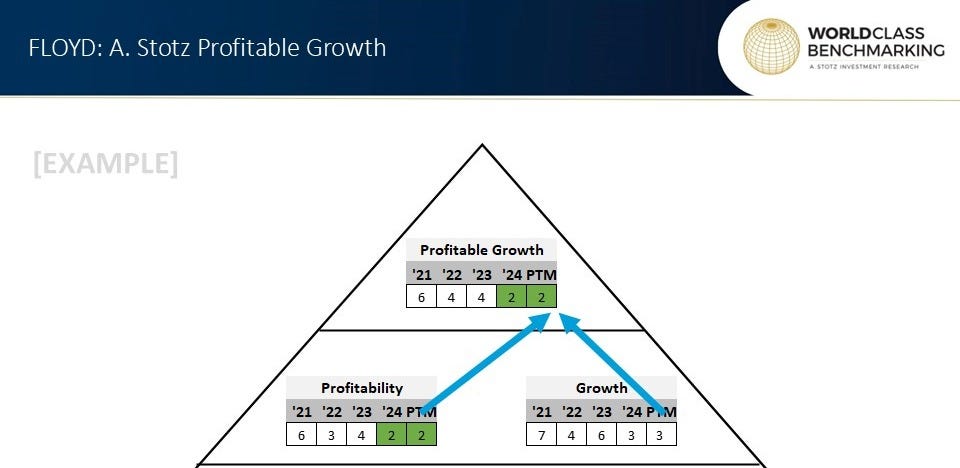
How to read the top of the triangle: Profitable Growth
Profitable Growth comes from a combination of the company’s score on profitability and growth.
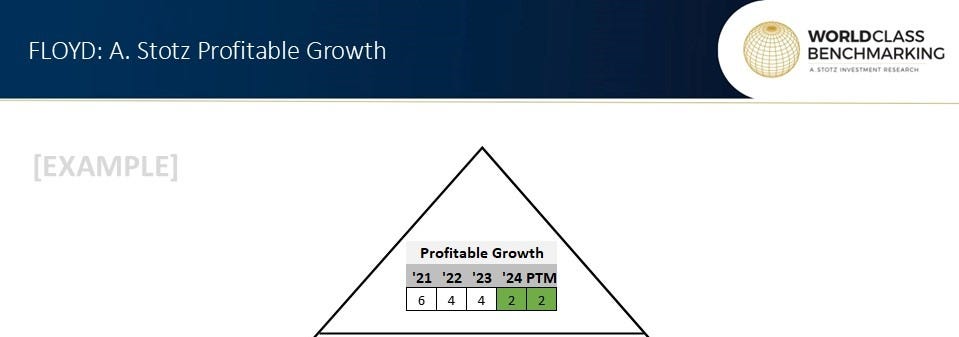
Strong profit growth with minimum asset use is great. Profitable Growth drives truly sustainable long-term value. There is a never-ending competition between high profitability and high growth. A company that generates more profits from its assets (such as physical, human, or software assets) can internally finance its growth.
How to read the middle of the triangle: Profitability and Growth
Profitable Growth comes from a combination of the company’s score on profitability and growth.
Profitability is measured as Profit divided by assets = Return on assets. Strong profitability means generating more profit from existing assets.
Getting more out of assets relative to peers means a company is more efficiently run and, over time, should be better able to finance its growth internally.
BEWARE: Very high profitability can dramatically slow growth.
Growth is measured as the annual percent change in profit per share = Earnings per share growth. High profit growth relative to peers indicates that customers want the company’s products and that the company can produce them profitably.
BEWARE: High growth at a low level of profitability is often a waste of money.
How to read the bottom of the triangle: Asset efficiency, Expense control, Revenue growth, and Expense direction
Each measure is explained by the two measures below it. We can see that asset utilization and profit margin produce the calculation of profitability, while sales growth and margin change make up the EPS growth. And it is our profitability and our growth that ultimately make the Profitable Growth.
Let’s review the two measures that drive profitability.
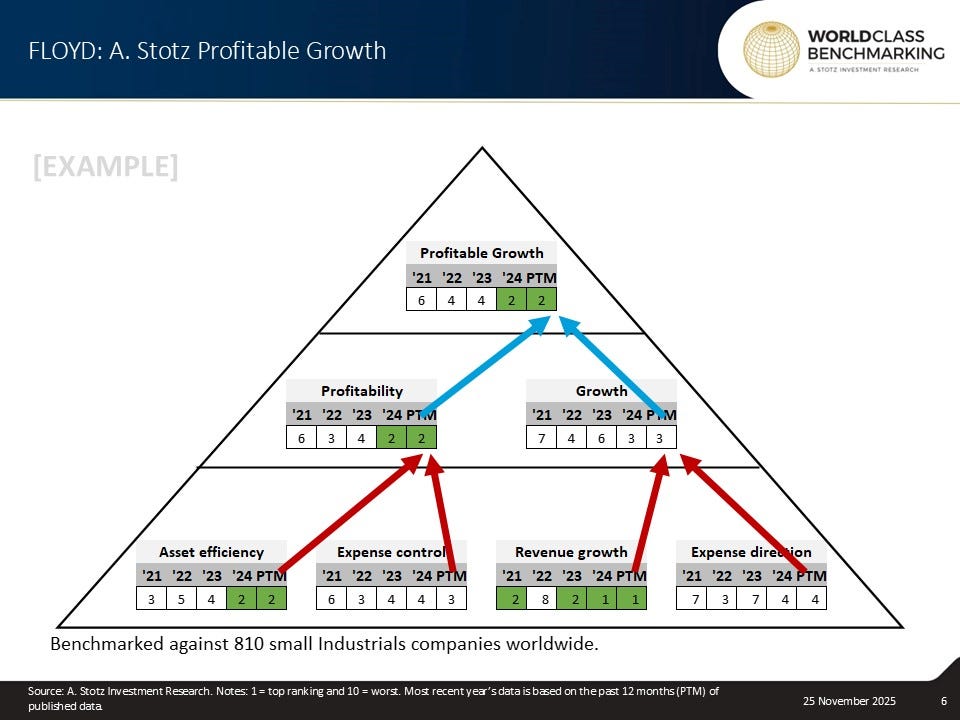
Note that you can see the peer group of the subject company below the triangle; in the above case, the peer group is “810 small Industrial companies worldwide.”
Asset efficiency is measured as Sales divided by assets = Asset turnover. It tells us the amount of revenue the company generates from its existing assets. Getting more revenue from a company’s assets relative to peers shows that management is better at generating output from their assets. Careful asset growth that is matched with revenue growth preserves the company’s capital.
BEWARE: A too slow asset growth policy can hold back sales growth.
Expense control is measured as Net profit divided by sales = Net profit margin. Profit is proof of competence. The profit margin shows how good the company is at cost control. A strong profit margin shows that products that customers want can be profitably delivered by management. It’s a good measure of the strength of the management team.
BEWARE: Too tight cost control can constrict growth.
There are two ways to increase EPS Growth. The first is sales growth – increase sales while keeping costs flat. The second is margin increase – maintain sales but reduce costs. There is a third thing that impacts EPS growth, and it’s the shares outstanding. Issuance of new shares reduces the EPS growth, all else equal, and vice versa. This will be reflected in the Growth rank in the triangle, even though it’s not shown separately in the breakdown.
Let’s review the two measures that drive EPS growth.
Revenue growth is measured as the annual percent change in sales = Sales growth. Sales growth is proof of concept. Sales growth proves that customers want the product. It’s the externally driven component of EPS growth. Weak sales growth means poor customer demand for the company’s products and services.
BEWARE: Sales growth without profit ends painfully.
Expense direction is measured as the annual change in net profit margin = Net margin change. Improving the profit margin is one of the fastest routes to strong EPS growth. For example, if a company improves its profit margin to 4% from 3%, while the margin of competitors does not change, then this is a margin improvement relative to peers. This comes from the management team’s focused effort. As the margin improves, the company is getting more profit from every sale.
BEWARE: Too high prices or too low costs could hurt sales growth.
Key takeaways: World Class Benchmarking
In World Class Benchmarking, we use a global universe of 27,000 non-financial companies. We rank all the companies from 1 (best) to 10 (worst) against all sector peers of similar sizes. The subject company is ranked against peers on six different measures, each of which is explained by the two measures below.
We have found that the share price performance of superior Profitable Growth companies beats their peers. Companies with large improvements in Profitable Growth rank yield the best share price returns.
Even if a company doesn’t rank high, the bottom of the triangle shows the strengths and weaknesses of the company. Improvements or negative trends in the lower levels of the triangle will sooner or later affect what really matters: the top of the triangle—Profitable Growth.
Hello, this is a great illustration of the world class benchmarking triangle. Do you have any examples of companies that have consistently scored in the first decile for profitable growth? Regards, Roman.